The Cost Of Rechargeable Vapes(2024 Ultimate Guide)
November 20, 2023
Best Pod System Vape (2024 Update) | VPFIT Brand Vape Manufacturer
November 21, 2023The U.S.vape market is expected to reach $34.137 billion in 2031
On November 19, according to the latest report released by Allied Market Research, the U.S. vape market size reach US$6.698 billion in 2020 and is expected to reach US$34.137 billion in 2031. Moreover, the compound annual growth rate from 2022 to 2031 is 16.1%. The market is segmented on the basis of product type, taste, and distribution channel.
Vape is recognized as a substitute for traditional cigarettes. It has some advantages like reducing health problems, being smoke-free, pollution-free, and being able to smoke in public places.
In addition, a report from the U.S. Centers for Disease Control and Prevention(CDC) shows that vapes are the most commonly used tobacco product among American teenagers. According to an article by the Australian Tobacco Harm Reduction Association, vapes carry at least 95% fewer long-term risks than smoking.
Vape use among U.S. teens drops to 10%
The U.S. Centers for Disease Control and Prevention (CDC) recently released a research report. It shows that the use of vapes among American teenagers has dropped to its lowest point in the past decade. The proportion of teenagers using fruit flavor vapes has dropped from 14% in 2022 to 10% in 2023.
The sharp decline is related to the increase in vape prices and the policy of raising the purchase age limit to 21 years old.

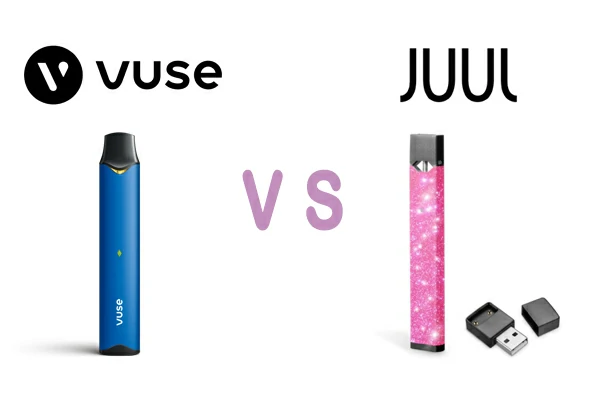
Vuse market share in the United States rises slightly to 42.1% Juul ranks second with 24.4%
Nielsen data: Vuse’s market share in the United States rises slightly to 42.1%, Juul ranks second with 24.4%.
The latest report from Nielsen Convenience Stores in the United States. It shows that the market share of Vuse vape owned by Reynolds Tobacco Company increased slightly to 42.1%. Thus surpassing second-ranked Juul, whose market share remained unchanged at 24.4%.
Moreover, the market share of Altria Group’s NJoy (ranked third) did not increase significantly and remained at 2.5%.
In addition, Altria and BAT warned an increase in illegal synthetic nicotine vapes in the U.S. vape market. According to the two companies’ estimates, these illegal synthetic vaping products account for about half of the domestic market in the United States.
The report covers the four weeks from the previous report to November 4. Nielsen’s data sources mainly come from large chain stores.


